Register for free and continue reading
Join our growing army of changemakers and get unlimited access to our premium content
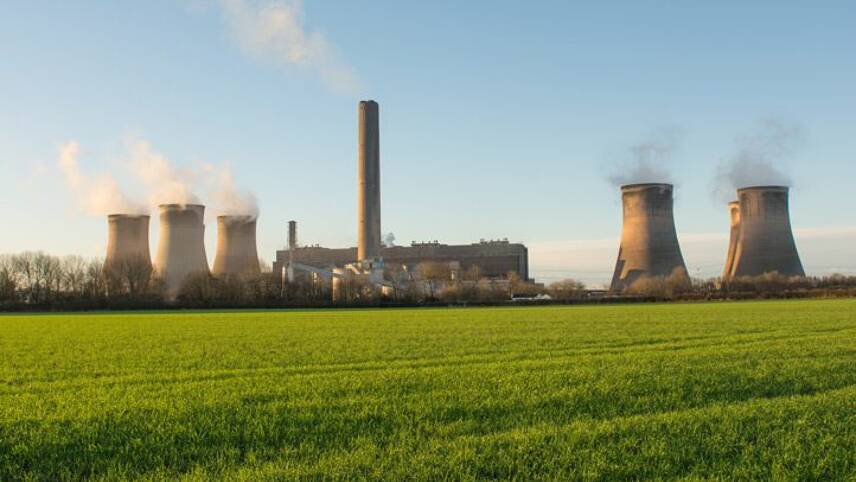
According to the ONS
The ONS data revealed that emissions produced directly in the UK did peak in 1972, and that emissions have fallen by 39% since 1990 while the economy grew by 70%. However, the latest data uncovers the UK’s carbon footprint if territorial emissions from imported goods and services were accounted for.
According to the data, UK emissions peaked in 2007 when imported emissions are considered, 35 years after the 1972 peak cited in traditional coverage.
“While directly produced UK emissions have been falling for many years, once you take account of the UK importing products from abroad, the picture doesn’t look quite so positive,” ONS’ senior economist Amina Syed said.
“However, UK-based firms, particularly those in the transport and energy sectors, have made big strides in recent years in reducing their carbon footprints.”
Under the Climate Change Act, the UK was targeting an 80% reduction in emissions by 2050 against a 1990 baseline. This covers all sectors, although international aviation and shipping are measured on a “territorial basis”.
Emissions in 2017 were 43% below 1990 levels, while the economy grew by two-thirds. However, if the territorial approach was replaced, it is believed that total emissions reductions are closer to 10% since 1997.
The Committee on Climate Change (CCC) has made numerous public calls for the UK to include territorial emissions from international aviation and shipping under the new net-zero target for 2050. However, the government formally rejected these calls on Friday (18 October).
Instead, Ministers confirmed that the government would continue with the recommendations of the International Civil Aviation Organisation (ICAO) and the International Maritime Organisation (IMO) as a global approach to decarbonising both sectors.
This isn’t the first time the UK’s decarbonisation legacy has been questioned. In April 2019, climate activist Greta Thunberg met with some of the UK’s most powerful politicians, chastising historic progress to combat climate change. Specifically, Thunberg noted that the UK was “very special, not only for its mind-blowing historical carbon debt, but also for its “very creative, carbon accounting” regarding territorial emissions.
According to the ONS, China was accountable as the biggest source of imported emissions, representing 82 million tonnes in 2015. Trade from the EU was second-highest at 45 million tonnes.
UK’s natural capital
Last week, the ONS also released updated estimates of the value of natural capital in the UK – the monetary value which can be assigned to planetary resources such as forests, oceans and clean air.
According to the ONS, the partial asset value of UK natural capital was estimated just short of £1trn at £951bn.
The data also found that cooling provided by shade and water saved the UK £248m in 2017, mainly through lowering air conditioning costs on hot days. In fact, 1,238 years of life were saved through vegetation removing air pollution in 2017.
The UK’s natural capital is also improving the attractiveness of the built environment. In 2016, houses located within 500 metres of green and blue spaces were estimated to be worth £78bn collectively.
The world’s total natural capital was valued at £53trn by the United Nations Environment Programme in 2010, with numerous reports having emerged since then presenting the potential benefits of adopting a natural capital approach.
A recent study by the UK’s Natural Capital Finance Alliance (NCFA) found that corporates across the globe are likely to miss a $1.6trn opportunity if they do not undertake natural capital accounting, such an approach integrates ecosystem-oriented management with economic decision-making and development by placing a financial value on natural resources.
Matt Mace


Please login or Register to leave a comment.