In numbers: How much waste is produced in the UK – and how much is recycled?
As part of edie’s Circular Economy Week 2022, we take a look at the official facts and figures about how much waste is generated each year in the UK, and outline recycling rates for waste streams including plastics.
Published 23rd May 2022
Register for free and continue reading
Join our growing army of changemakers and get unlimited access to our premium content
This week (23 – 27 May) is edie’s Circular Economy Week – a week-long editorial campaign designed to inform and inspire sustainability, energy and resource efficiency professionals to take bolder steps towards an economy free from waste.
As part of this campaign, this feature provides a snapshot of the levels of waste currently being generated in the UK and of how this waste is managed. It covers plastics, e-waste, food waste and waste from construction, demolition and excavation.
The UK Government’s Department for the Environment, Food and Rural Affairs (Defra) recently published finalized statistics on household waste generation and recycling during 2020 – the most recent full year for which data is available. That paper confirmed that the UK had missed its target to recycle 50% of household waste by 2020. The recycling rate for household waste dipped from 45.5% in 2019 to 44% in 2020, with Defra attributing backwards progress to Covid-19 lockdown restrictions.
Challenges to the circular economy during lockdown included disrupted recycling collections, increased use of hard-to-recycle masks and PPE containing plastic, and the ending of in-person refill services.With lockdown restrictions now lifted in the UK, there is a major opportunity to increase the focus on the circular economy in policymaking and across the private sector. Here, edie provides an updated baseline from which progress must now be made.
Setting the scene
The last full calendar year for which Defra has data on all waste generated in the UK in 2018. While it has published household waste data for 2020, figures are still being finalized for commercial and industrial (C&I) waste and for construction, demolition and excavation (CD&E) waste.
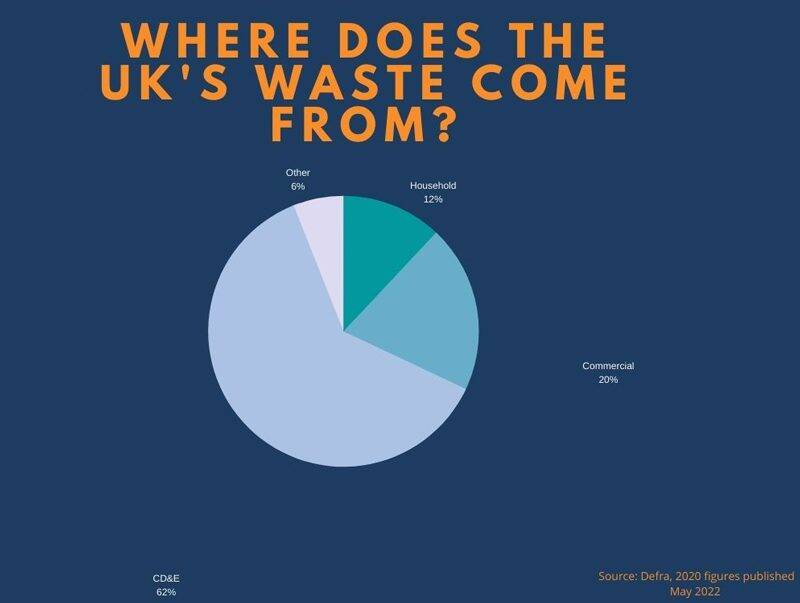
The UK generated 222.2 million tonnes of waste in total in 2018. England accounted for 84% of this total.
Of this 222.2 million tonnes of waste, 19.75% was C&I; 62% was CD&E; 12% was from households and the remainder came from other sources.
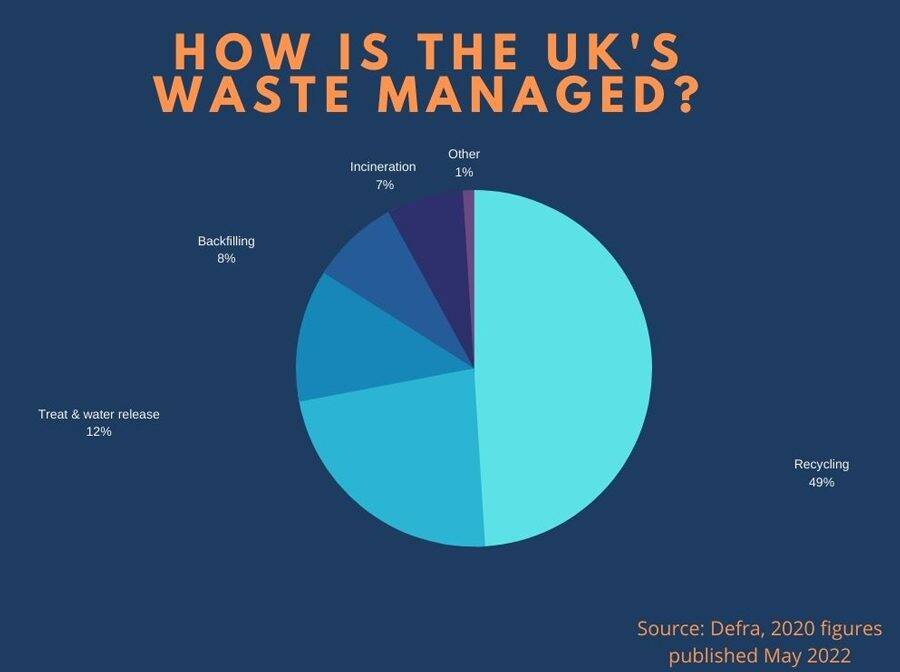
Of this 222.2 million tonnes of waste, 48.7% was recycled or otherwise recovered. 22.8% was sent to landfill. 11.5% was treated and released into bodies of water. 7.5% was used for backfilling – the process in which waste is placed into excavated areas or used for engineering purposes. 4% was incinerated to generate energy-from waste and a further 3% was incinerated without energy recovery.
Plastic
Defra’s figures show that plastics accounted for just 1% of the UK’s total waste mountain in 2018, by weight. But plastics have been one of the most high-profile environmental topics in recent years, due to growing scientific and public awareness of their impacts on nature and on human health.
Plastics come with waste management considerations which do not apply to many other common packaging materials. For example, they take centuries to break down and do not degrade completely, instead splitting into ever-smaller particles. Most plastics can only be recycled two or three times before its quality decreases too much for most applications.
According to WRAP, packaging accounts for the majority (70%) of the UK’s annual plastic waste production. Much of the remaining plastic is used in agriculture and logistics.
It is unsurprising, then, that the Resources and Waste Strategy’s key inclusions on plastics are largely targeted at plastic packaging. The Strategy confirms that the UK will implement a Deposit Return Scheme for drinks packaging in 2024, for example.
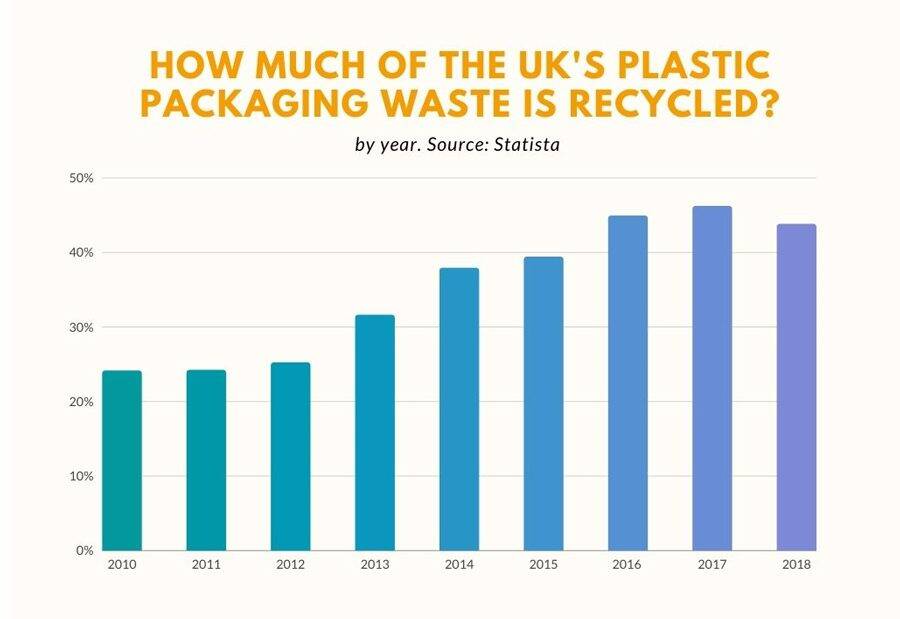
The UK’s recycling rate for plastic packaging has remained fairly stagnant for the past five years. Statista has recorded a sharp increase between 2008 (23.7%) and 2016 (44.9%), and then a plateauing. This is far higher than the global average rate to date of 9% for all plastics but still means that most plastic packaging is being burned, landfilled or littered.
E-waste
The UN regards e-waste (wasted electronics and electricals) as the world’s fastest-growing domestic and commercial waste stream, with waste generation vastly outstripping expansions to recovery systems, repair and recycling infrastructure.
According to the body’s Global E-Waste Monitor Report, the UK generated 23.9kg of e-waste per capita in 2019. While this was down from 24.9kg in 2016, the UK still generated the second most e-waste per capita in the world, behind only Norway (26kg). 7.3kg per capita was the global average. 2019 is the last full calendar year for which the UN has made Global E-Waste Monitor data available. A new report is expected this year, with 2021 figures.
Quarterly e-waste figures for the UK specifically are collected and published by the Environment Agency. The rate of recycling and reuse for waste electrical and electronic equipment in the UK for 2021 was 31.2%. This was above the UN’s global average rate for 2019, of 17.4%. However, e-waste can be extremely damaging to nature and human health when not properly managed, so there will always be a drive to improve recycling and reuse rates.
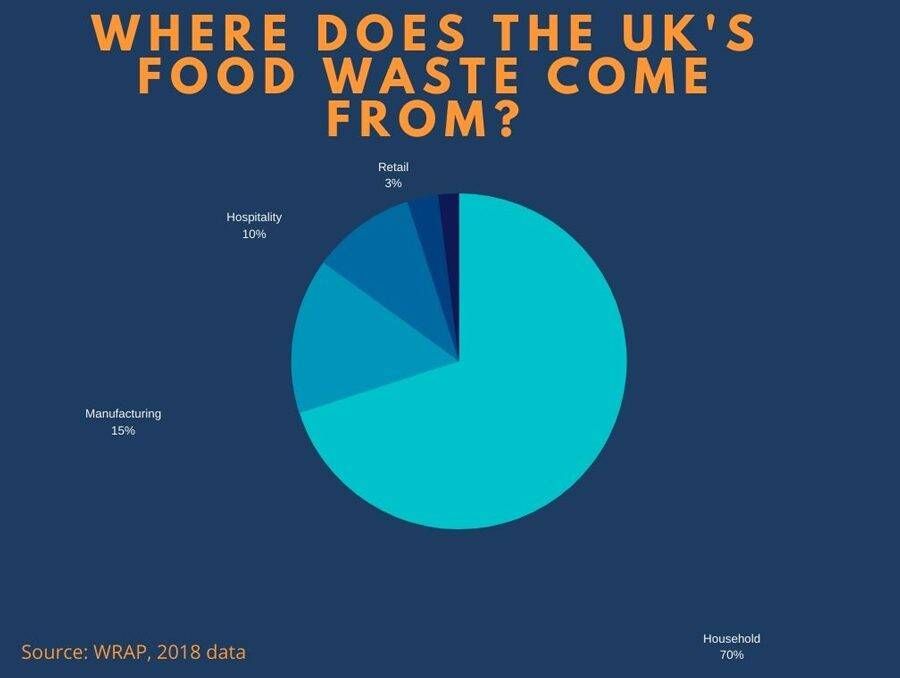
Food waste
Globally, between 33% and 40% of all food produced each year goes to waste. WWF estimates that 2.5 billion tonnes of food were wasted globally in 2020, up from 1.3 billion tonnes in 2010.
WRAP estimates that around 9.5 million tonnes of food is wasted in the UK each year, with 70% of this food still being fit for human consumption.
WRAP’s figures are for 2018 and the organisation is yet to produce updated figures for a more recent year. There are hopes that food waste from households will have reduced during 2020 and 2021, with lockdown restrictions leaving most people with more time at home and compelling many to rethink their food budgets. WRAP’s self-reported figures revealed these trends.
Food waste is not only a resource issue – it’s clearly interlinked with social sustainability and the climate crisis. On the social side of things, the Food Standards Agency estimated that 15% of people living in England, Wales and Ireland were food insecure last Spring. This proportion is expected to rise amid the cost of living crisis.
As for climate, WWF estimates that food waste could account for 8-10% of global annual emissions – a larger proportion than shipping and aviation combined. WRAP estimates that around 5.5% of the UK’s annual emissions can be attributed to food waste.

CD&E
This article has, so far, focused on some of the most significant domestic waste streams. But, with CD&E accounting for the greatest proportion of the UK’s waste, it bears highlighting here.
The last full year for which Defra has published the recovery rate for CD&E waste is 2018. A record recovery rate of 92.3% was recorded. The UK Government counts reuse, recycling and backfilling as ‘recovery’.
Strong recovery rates can be attributed to a number of factors. Businesses in construction and demolition are legally required to follow the waste management hierarchy, reducing, reusing and then recycling. Construction materials are also often higher value and easier to reuse or recycle than the items we place in our bins at home.


Please login or Register to leave a comment.